Blog · Part 3 of 3 · Testing and evaluating GenAI systems
Why I lowered my own maturity score
On measuring the ability to measure, and staying honest with my own scorecard
- in two weeks
- 37.9% to 84.5%
- through self-audit
- 6-point drop
- techniques at L4
- 8 / 12
- points in the heaviest phase
- 20 / 32
In short
- The scorecard measures how accurate the data is; the maturity score measures how well I can measure that. Each of twelve techniques is scored from L0 to L4.
- The score went from 37.9% to 89.7% in two days. A self-audit eleven days later showed that two techniques had no L4 evidence, so I lowered the score to 84.5%.
- Levels are no longer declared; they are derived from evidence. If a declared level exceeds the ceiling the code computes, the test suite turns red.
- Most of the gain came from the robustness techniques. The heaviest phase ended the two weeks where it started.
Two questions, two numbers
When you build an evaluation framework, the first thing people ask is “how are the results?” But there is a question that should come before that one: how well can I measure those results?
The scorecard answers the first question: how accurate the data is and how robust the system is. The maturity score answers the second, which is about my ability to measure in the first place. Mixing the two up creates a dangerous situation: in an area you never measure, you never see a problem either, and that looks like success.
That is why the scorecard has two columns: the target and what is measured today. An unmeasured cell is not a blank dash; it says “not measured” explicitly. The headline metrics are:
| Metric | Target | The question it asks |
|---|---|---|
| Field accuracy | ≥ 98.7% | Are the cells correct? |
| Consistency (pass^5) | ≥ 97.1% | Is the result the same in all five repeats? |
| Structural robustness | ≥ 94.3% | Does the output stay the same when the input’s structure changes? |
| Grounding | ≥ 96.2% | Does the agent write only what it observed? |
| Recovery | ≥ 91.8% | Does the system recover when a dependency breaks? |
| Injection defense | = 100% | Does an instruction hidden in the content take effect? |
| Silent failure | = 0 | Does broken input get a PASS with a wrong value? |
From L0 to L4
Each of the twelve techniques is scored at one of five levels. The level definitions are closed; every level requires an evidence file or a run.
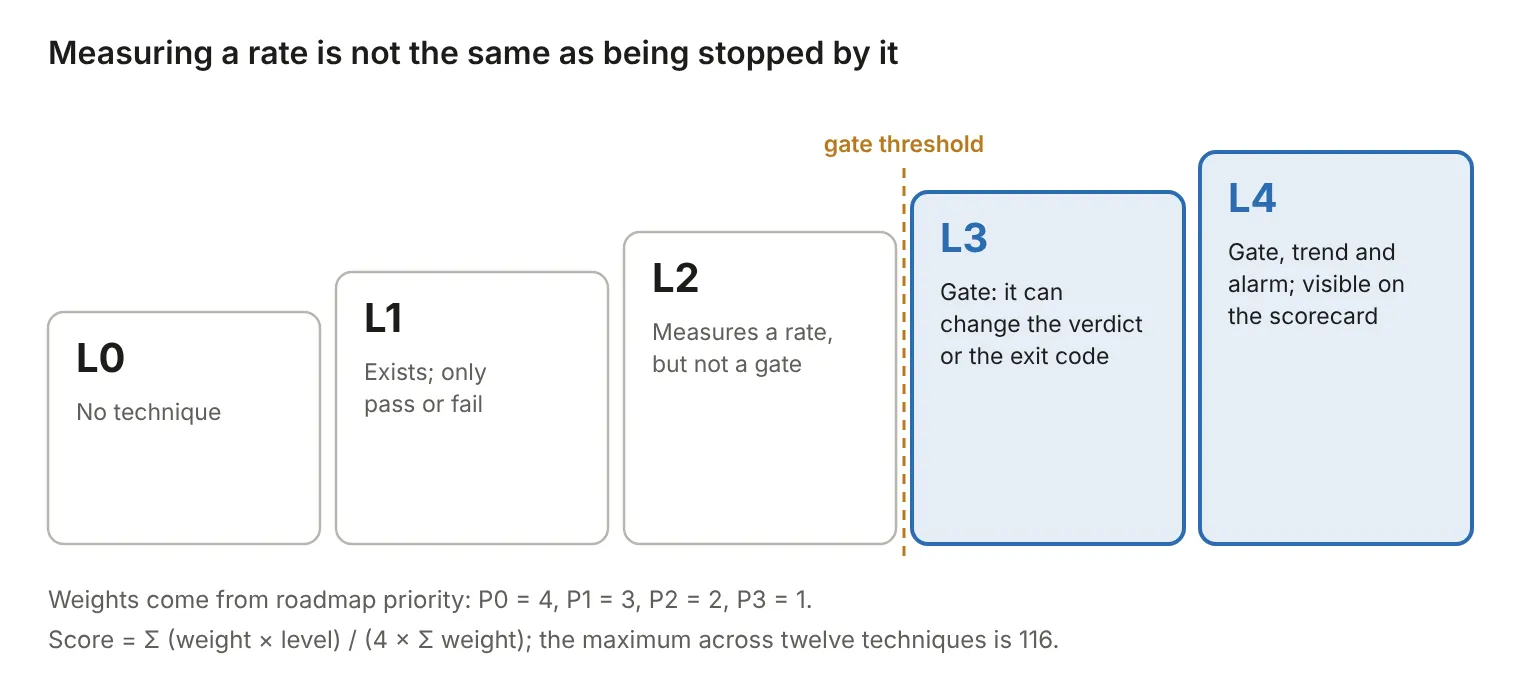
The difference between L1 and L2 is the difference between “did it pass?” and “by how much?” The difference between L2 and L3 matters more: measuring a rate is not the same as that rate being able to stop a release. L4 adds time: the gate holds, the trend is tracked, and an alarm goes off after two consecutive declines.
Each technique’s weight is its priority on the roadmap. Core reliability (P0) carries a weight of 4, robustness (P1) 3, agent depth (P2) 2, and chaos and drift (P3) 1. The total weight of the twelve techniques is 29, and the maximum score is 116 points. The score is the sum of the weighted levels divided by that maximum.
The two-week trajectory
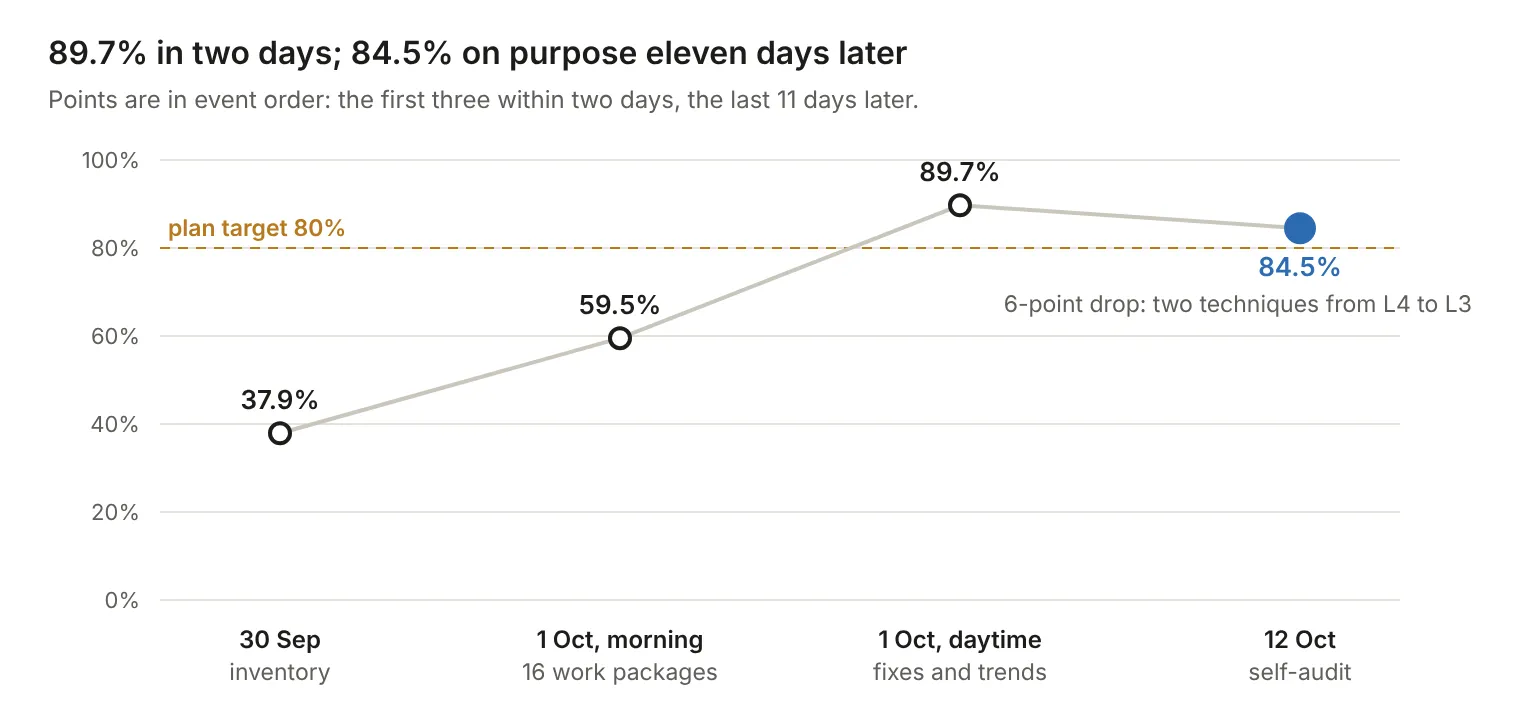
On 30 September, when I pulled the inventory out of the code, the score was 37.9%. Two techniques did not exist at all, three only said pass or fail, and six measured a rate but stopped nothing. Only one was a gate, and none was at L4.
In a single night, 16 work packages were coded and the score rose to 59.5%. The next day I fixed the bugs that had surfaced and set up trend tracking and alarms: 89.7%. The plan’s target was 80% by the end of four phases; I had passed it in two days.
A rise that fast should have reassured me. Instead, it made me suspicious.
Why I lowered it
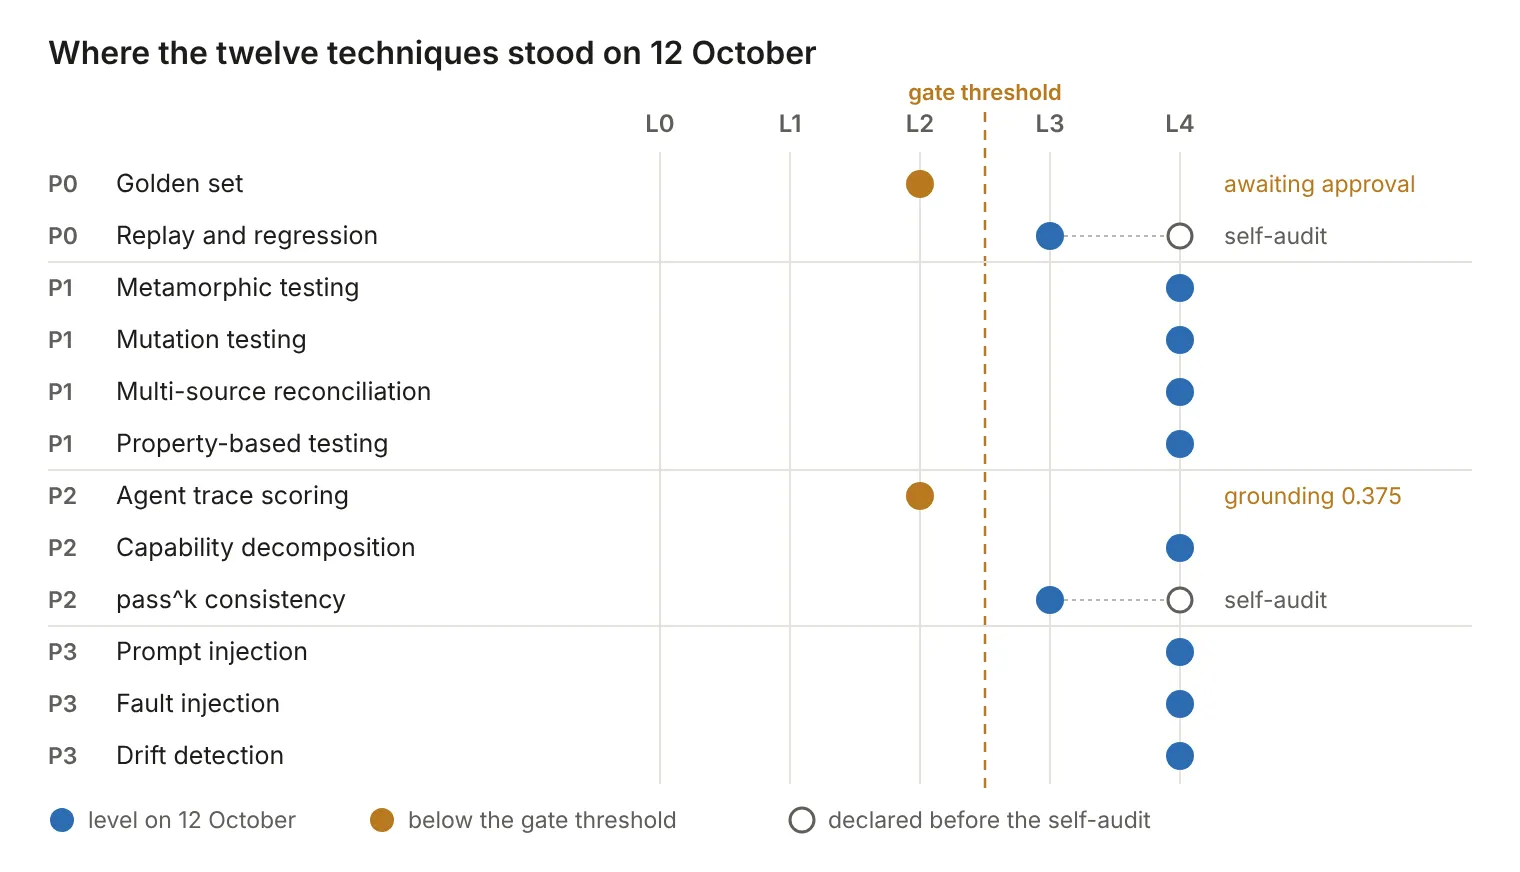
After writing down 89.7%, I re-audited the evidence for every technique, one by one. The question was simple: where is the evidence that carries this level? Ten techniques were listed as L4. For two of them, the evidence did not support L4.
Consistency (pass^k). The metric in the gate was repeatability on recorded input, and it was already at the ceiling: 1.00. But the question this technique should be asking is about the LLM’s stochasticity. As I showed in the previous article, that number looks very different: across 95 sources, zero passed all seven repeats. I lowered it to L3.
The metric had the right name; it measured the wrong thing.
Replay and regression. The evaluation job called the regression suite without parameters, and every time the suite honestly reported “not measured”. There was not a single regression record in the shared history, which meant there was no trend either. I lowered it to L3.
The score fell from 104 to 98 points, from 89.7% to 84.5%. I wrote the drop into the scorecard and the management report exactly as it was. Interestingly, the drop earned more trust than the rise had: everyone now knew what the score measured.
Where did the gain come from?
Breaking the score down by technique and by phase gives a more instructive picture.
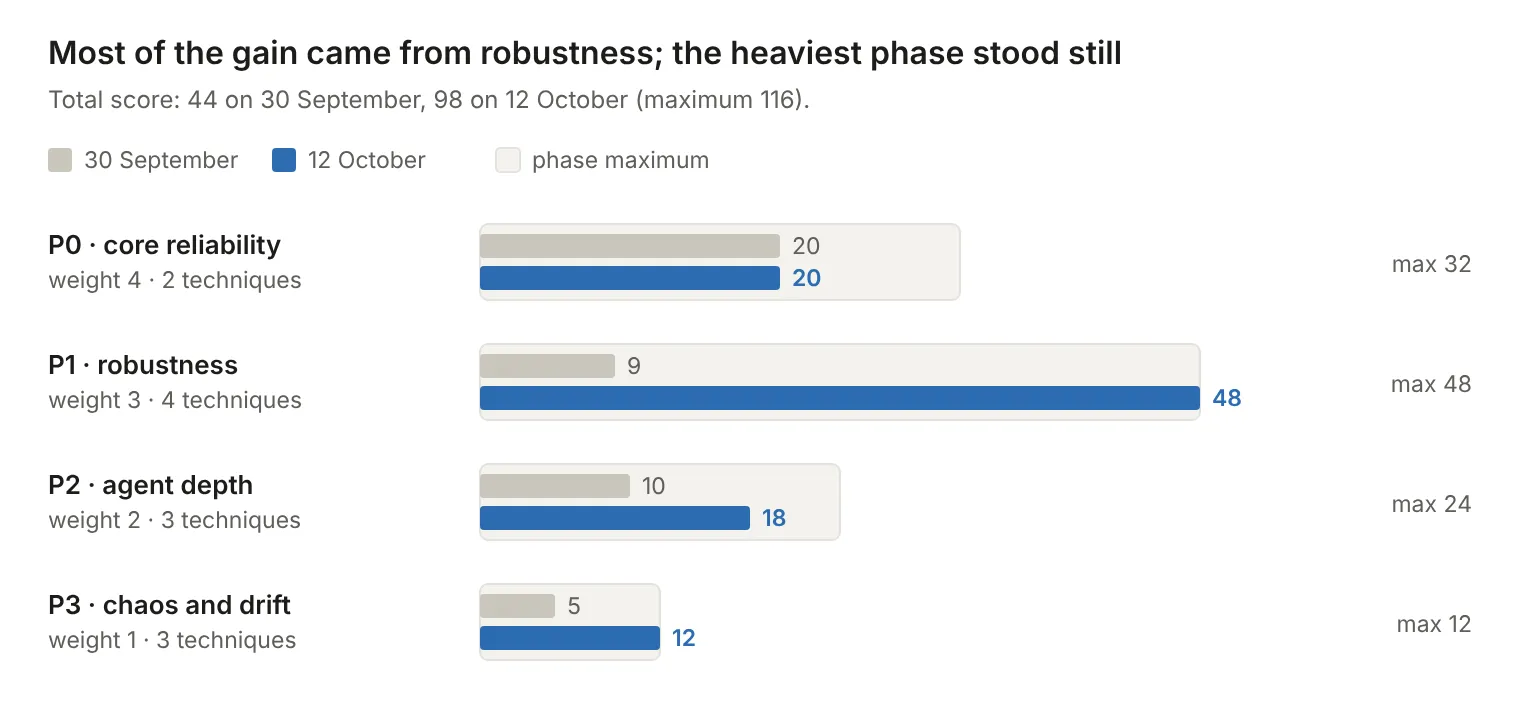
The robustness techniques went from 9 out of 48 points to 48 out of 48; all four are at L4. Chaos, drift and injection sit at 12 out of 12. But the heaviest phase, core reliability, ended the two weeks where it started: 20 out of 32 points. Along the way, replay climbed to L4 and came back down in the self-audit; net progress was zero.
That is something the score does not tell you on its own. I moved fastest where progress could be made by writing code. Approving the golden set takes a person’s time; building up a replay trend takes a regular run. Neither can be coded overnight.
The fastest progress came where code alone was enough.
Moving the score from declaration to evidence
After the drop, I changed the rule: levels are no longer declared, they are derived from evidence.
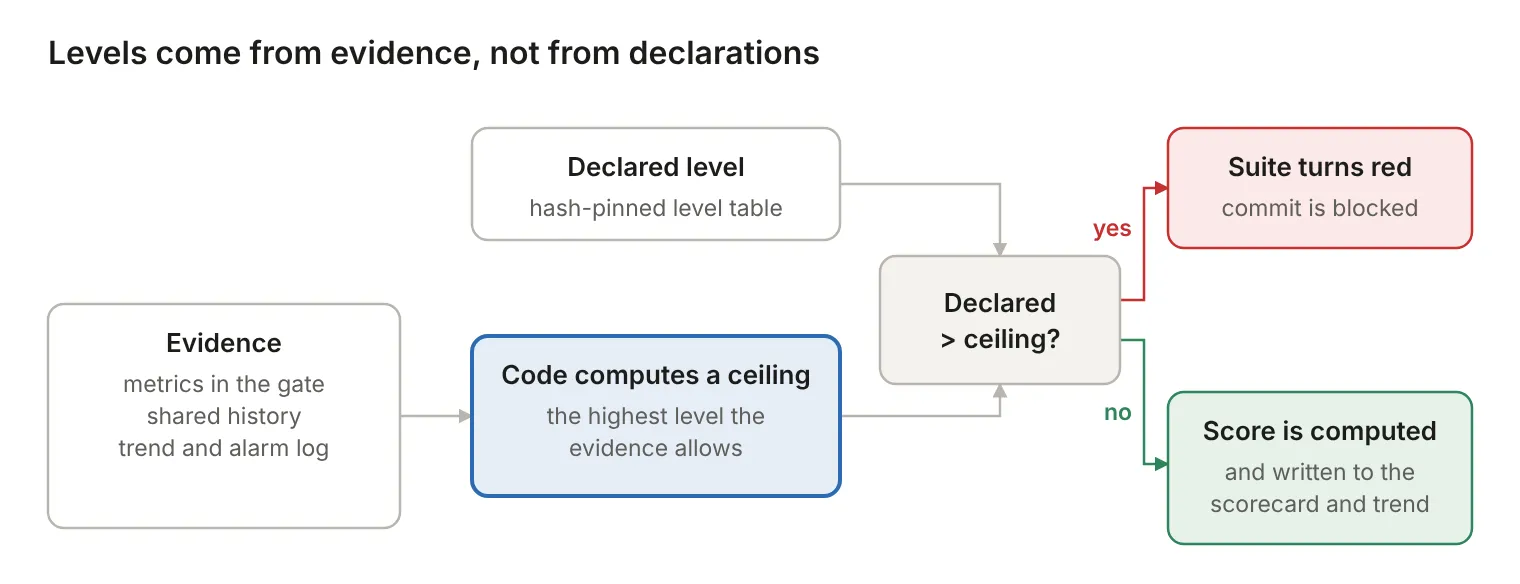
The score is computed by a tool, not by hand. Some levels require specific metrics to be in the gate. For consistency to reach L4, a real LLM stochasticity metric has to enter the gate; that metric does not exist yet, so the technique is at L3 in the code as well. A level changes only when the acceptance criterion of the related work package has actually been measured.
Agents built most of this framework. In the first article I described how I tested the model’s “I did it” claims against evidence. The maturity score became the same principle applied to the framework itself.
What is still low
- Golden set at L2. There is a draft set for eleven sources, but agents wrote it. The agent that wrote a set cannot approve it; until a human signs off, field accuracy is officially “not measured”. This is a deliberate limit.
- Agent trace at L2. Grounding is 0.375 against a target of 0.962. When a tool call fails, the agent writes endpoints it never observed.
- The trend is short. The evaluation job is not yet on a regular schedule; the trend rests on three manual runs. That means the trends for the eight techniques at L4 are also still short. I lowered replay because it had no trend records at all; the others have records, just not long ones. Until a regular run is in place, these trends will not reach a meaningful length.
I don’t hide these in the scorecard. On the contrary, they are its most visible rows.
Takeaways
- Track data accuracy and measurement capability as separate numbers.
- Write “not measured” for what you have not measured, not a blank dash.
- Compute the score from code; a score updated by hand inflates.
- Look at what a metric measures, not at its name.
- Be suspicious of a score that rises fast, especially when agents are the ones raising it.
- An 84.5% you can explain is worth more than an 89.7% you can’t.
These three articles came out of a single project, but the lessons are not specific to it. I would be glad to talk through this experience with anyone who is building, or thinking of building, a similar framework.
The figures are my own measurements (September–October 2026). Project, domain and organization names are deliberately left out; what I describe here is the method I used and what I learned.
First published on this site on 18 October 2026.